KidZone Math
Valentine's Day Graphing
Graphs allow children to practice counting, sorting, comparing and observing data. For most younger children, graphing is usually best practiced using real objects -- items they can
touch and observe -- rather than abstract ideas (for example, using tally marks to create a graph). These Valentine's Day graphing worksheets use smarties!
Materials:
- Box of red and pink smarties (or similar candies in red and pink). We bought a large bag of 24 "snack size" boxes of smarties for about $5 at Safeway. If working with a group of children, you can buy a large bag and use it to make your own small ziploc snack
bags of them. There should be no more than 30 of each color in the bag.
- Templates (see below)
Image Summary of Printable Worksheets:
| prediction | estimate | tally | bar graph |
 |
 |
 |
 |
| (color) or (B&W) | (color) or (B&W) | (color) or (B&W) | (color) or (B&W) |
Introduction:
The Valentine's Day graphing projects build on each other and are, therefore, suitable for grade 1 through grade 3.
Grade 1 students should do the predictions and tally worksheets.
Grade 2 students should do the predictions, estimation, and tally worksheets.
Grade 3 students should complete all the worksheets: predictions, estimation, tally and bar graphs.
Note: Every child is an individual. As with everything on the website, these grade levels are just a suggestion. Ability of the child, level of supervision and size of the group all play a role in whether the project is suitable.
Project 1: Predict the Number of Candies
Talk to the children about "predictions". A prediction is a fancy word for a guess about the future. Predictions can be made lots of different ways:
- It can be based on scientific information like a database of statistically valid samples.
- It can be based on
previous knowledge -- like what happened last year.
- It can be based on chance -- ex: if I roll dice and it's an even number, there will be more orange candies.
- It can be based on superstition -- ex: if I see a black cat the day before, there will be more brown candies.
Encourage the children to chose the way they want to make their predictions.
 |
 |
| color worksheet | black & white worksheet |
Project 2: Estimate the Results
An estimate is a calculated guess of the approximate amount of an item without having exact information.
Divide the smarties into two separate piles.
Estimate how many pink candies and how many red candies are in your piles. Don't count! Just estimate.
 |
 |
| color worksheet | black & white worksheet |
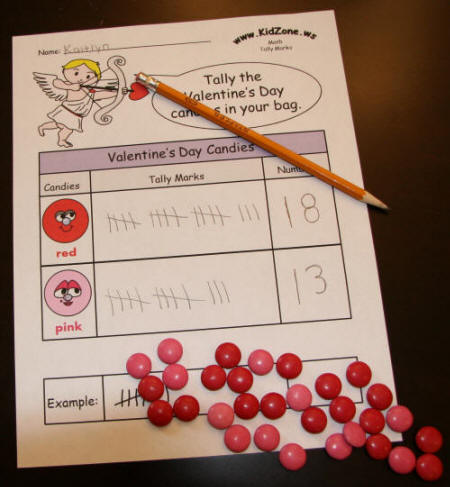
Project 3: Tally the Results
Tally marks are a quick way to visually count a large number of results. Rather than trying to keep track of a count, you make a tally mark for each item, then you can count the tally marks (by 5's). This is an intermediate step for graphing.
 |
 |
| color worksheet | black & white worksheet |
Project 4: Bar Graph the Group's Results
Using your tally worksheet (or starting from scratch), make a bar graph of your bag of Valentine's Day candies.
 |
 |
| color worksheet | black & white worksheet |